Inflation Schedule
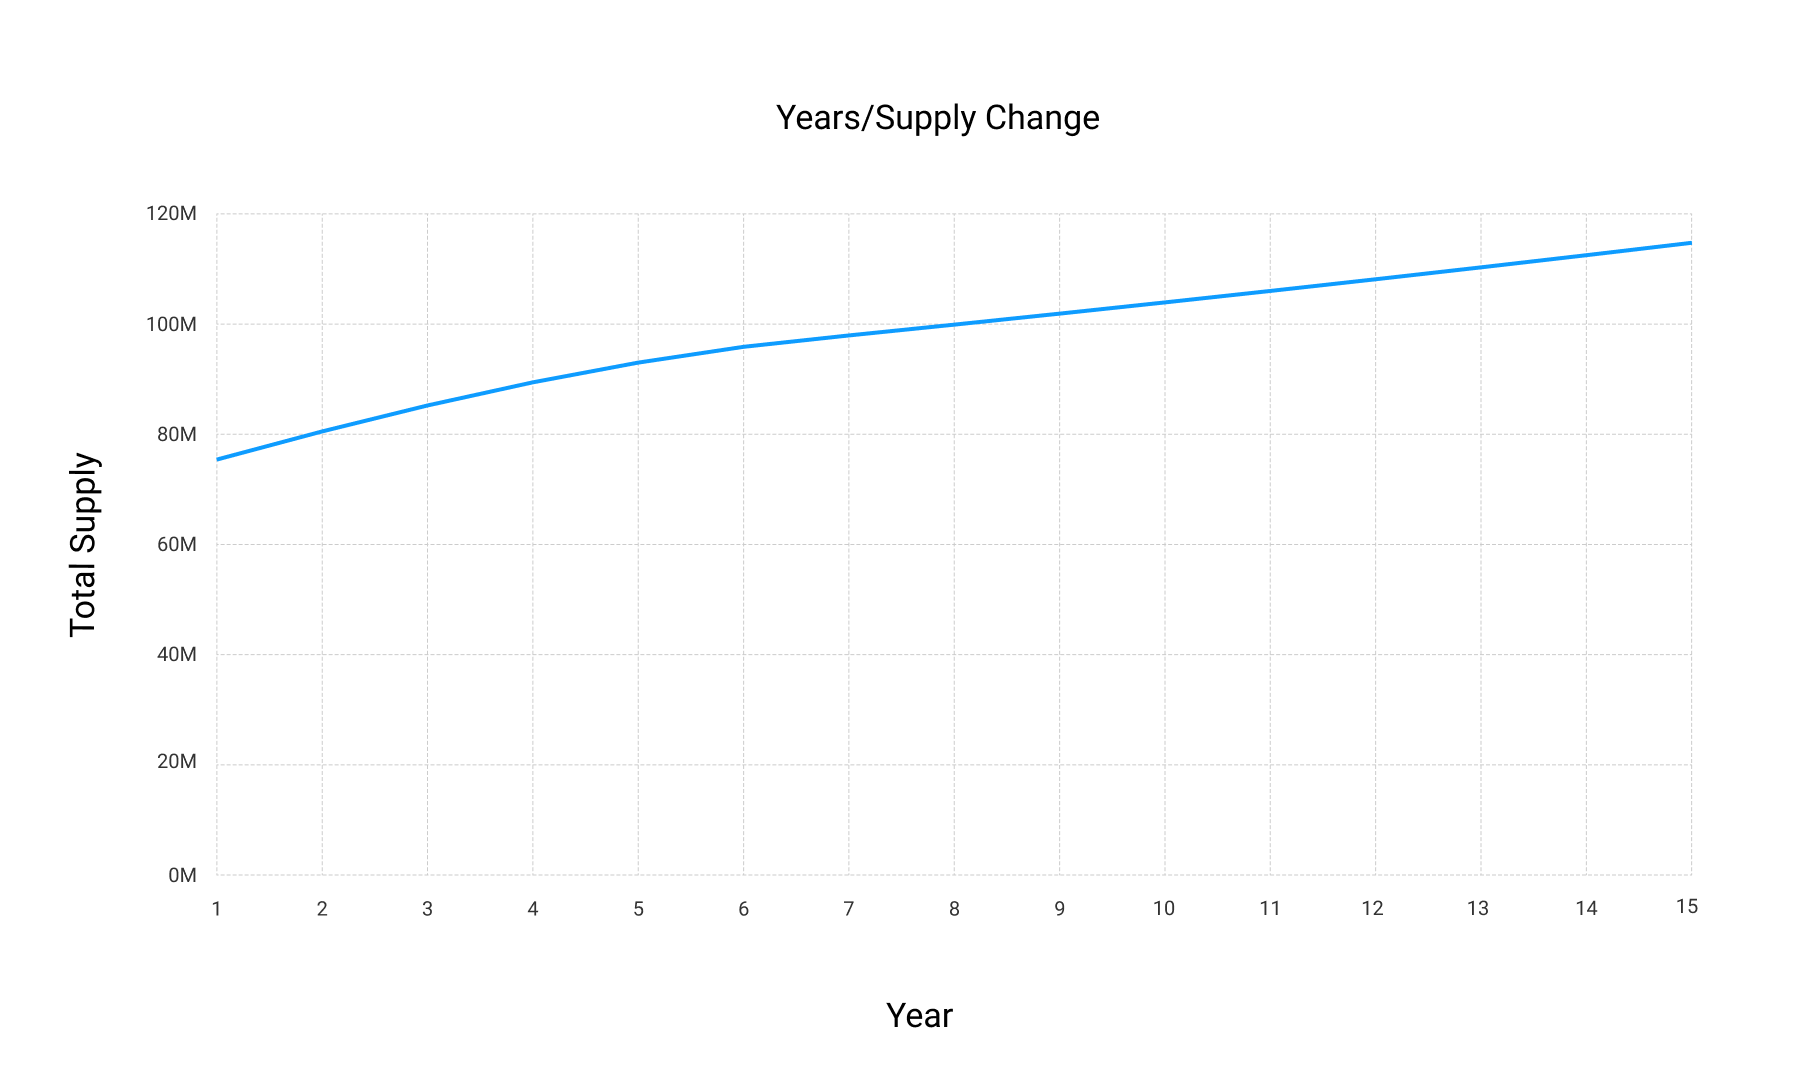
First of all, without regard to the other factors, listing the changes in the supply of transformers inflation rates over time(year). From the initial inflation, the change curve of TTOS's total circulation after the issuance of the planned time cycle, please note that what is shown here will be the largest share of the additional TTOS releases.
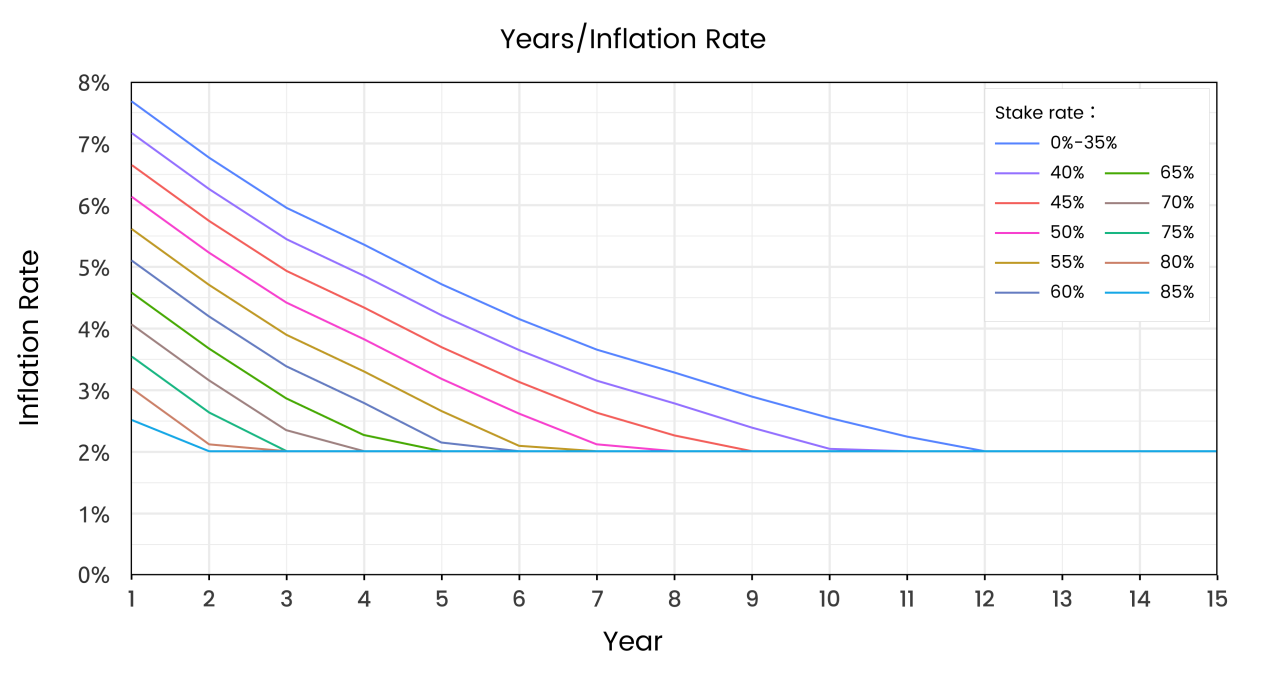
 Transformers during the time cycle, assuming that the influence of stake rate on the inflation rate, the change curve for the maximum inflation rate by time is as follows:
 The inflation rate of transactions will be affected by the time cycle and the stake rate, it takes some time for the total stake to rise at the initial start of the network, due to the interaction between the various economic parameters, if the calculation of the inflation rate changes from the stake rate,
it will lead to a sharp rise in the early stake yield, early network participants will receive a vast amount of TTOS tokens, this is detrimental for later progression, therefore, the transformers stake rate is within the 0%-35%change range, the inflation rate is not affected by changes in the stake rate, the affected calculation range of the inflation rate is the stake rate of 35%-90%.
The inflation rate of transactions will be affected by the time cycle and the stake rate, it takes some time for the total stake to rise at the initial start of the network, due to the interaction between the various economic parameters, if the calculation of the inflation rate changes from the stake rate,
it will lead to a sharp rise in the early stake yield, early network participants will receive a vast amount of TTOS tokens, this is detrimental for later progression, therefore, the transformers stake rate is within the 0%-35%change range, the inflation rate is not affected by changes in the stake rate, the affected calculation range of the inflation rate is the stake rate of 35%-90%.
The following figure shows the change in inflation rate in the process of stake rate change in each fixed period. Please note that the stake rate in the chart is a fixed-value sampling, and the actual change range of the stake rate is 35%-90%. Every 1% increase in the stake rate shrinks the initial inflation rate by 1.35%.
 The following figure shows the change chart of the inflation rate under the same action of the period and stake rate. Time cycles are from the first year to the fifteenth year(stake rate is fixed value sampling).
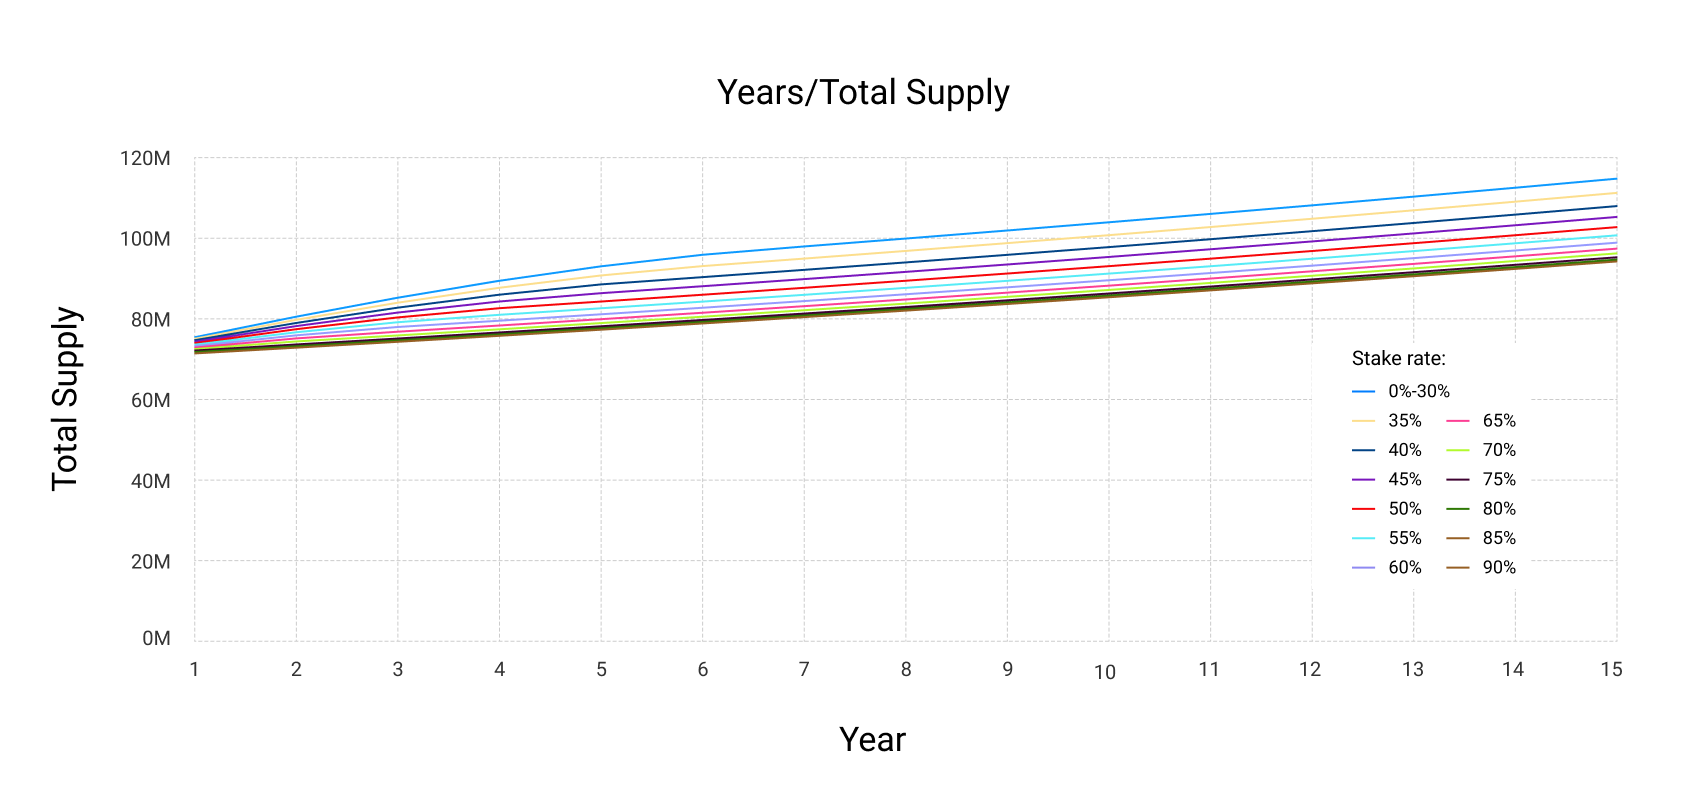
 The following figure illustrates the change chart of TTOS total circulation supply under the combined action inflation rate, changes arising from the destruction event and the destruction agreement are not considered.
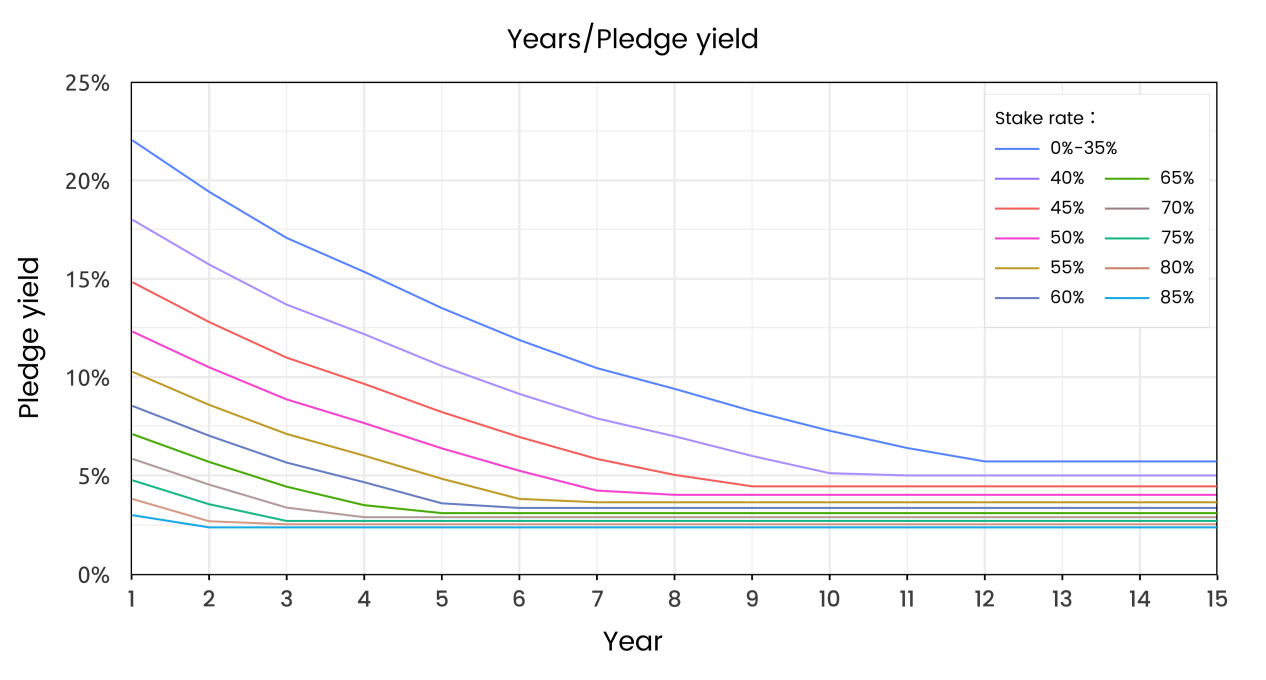
 The economic indicators of the verification of the stake yield in the transformers network are presented below. Firstly, the factors affecting the yield of stake are the inflation rate, stake rate, and verifier workload compliance rate, the functional relationship between them is as follows:
Stake yield TTOS%= (Inflation%÷stake rate % ) × validator workload compliance rate%
The workload index of the Transformers network validators adopts the quartile anomaly number algorithm: Q3=3* (n+1)/4. The validators that meet Q3 are calculated as a 100% compliance rate, while those lower than Q3 are regarded as abnormal validators and will not be rewarded.
The following figure shows the stake yield chart under the condition of 100% workload compliance rate changing with time cycle and stake rate. The stake rate is a constant value sample in the chart, and the actual change range is 35%-90%.
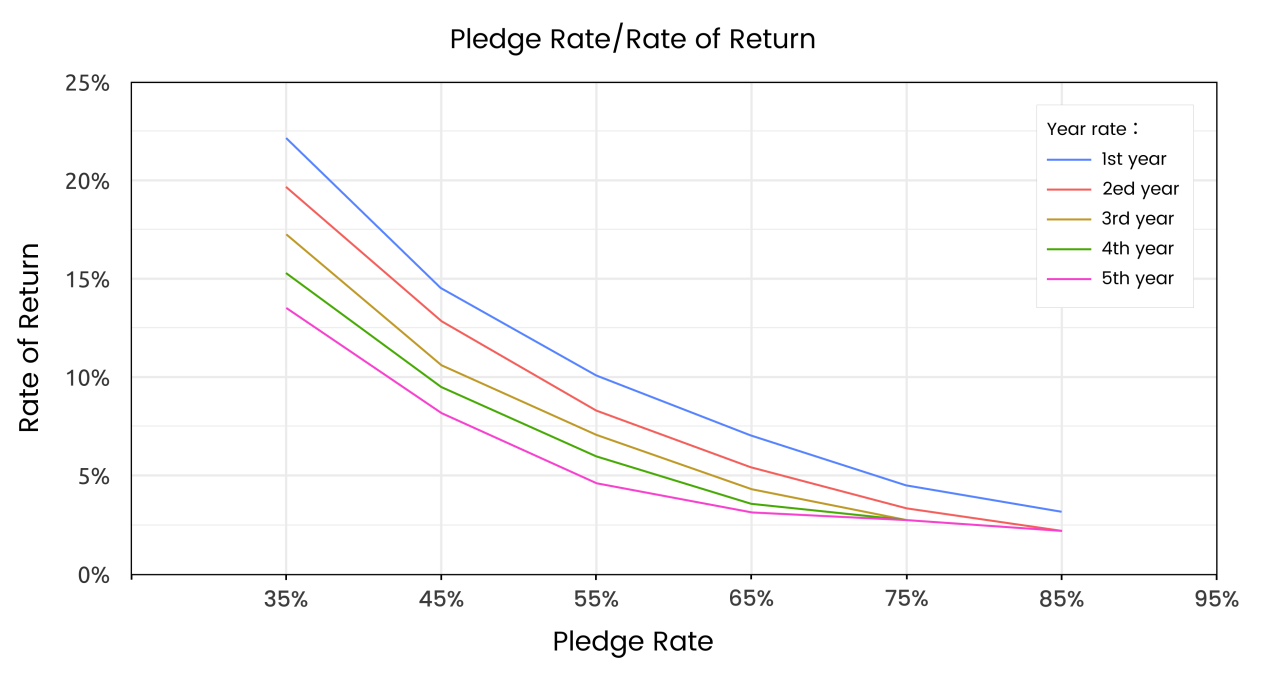
The above content is all the economic indicators that the transformers validator needs to focus on in the network. The relevant chart is also shown and tries to fully understand the relevant economic data of TTOS through the above content authenticator, which is better handle the economic problem encountered by the authenticator for participation in the network process and obtaining the inflationary incentives generated in the transformers network interaction behaviour.